In late 2015, we were asked by our friends at All Home King County to produce a visual to represent the results of the 2016 One Night Count — an annual count of the number of people outside, unsheltered on a winter night in King County. We worked closely with All Home to answer the questions, Who is homeless? Why are they homeless? And, what can we do about it? to highlight some data to help contextualize the One Night Count number. The result is the infographic, Homelessness in King County: Who, Why, and What Can I Do?
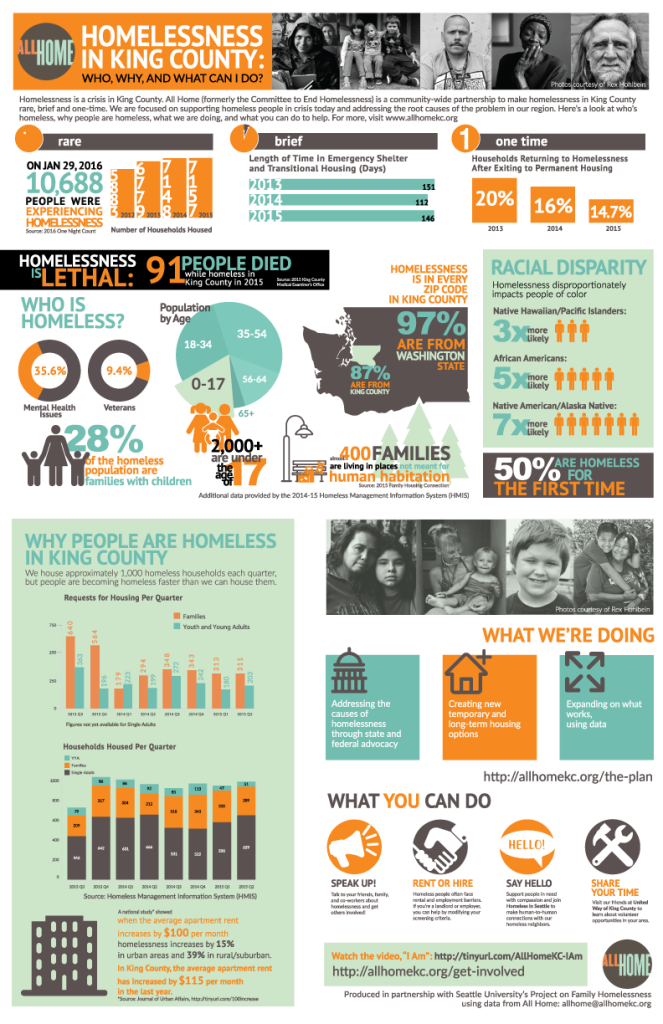
The infographic was released on January 26, 2016 and shared widely as an education and advocacy tool.
WORK TYPE: Infographic
CLIENT: All Home King County
DESIGNER: Amy Phung & McKenna Haley
YEAR: 2016
