Building Changes in October 2018 released a landmark report on academic outcomes of students experiencing homelessness. To spark attention to the three key outcomes, and to drive people to read the full report, they asked us to create an infographic for each data point.
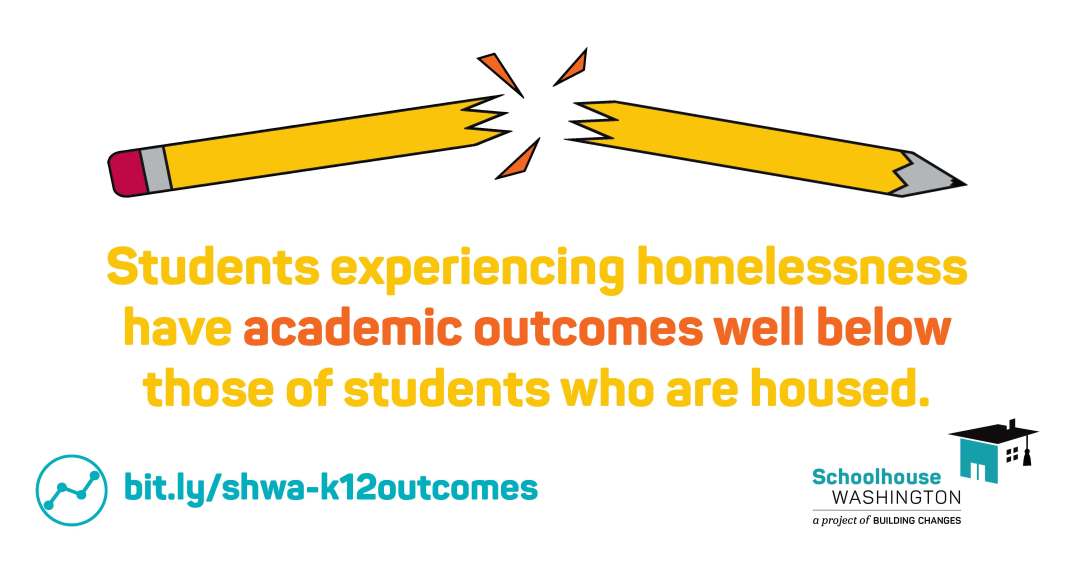
Download a pdf of this infographic
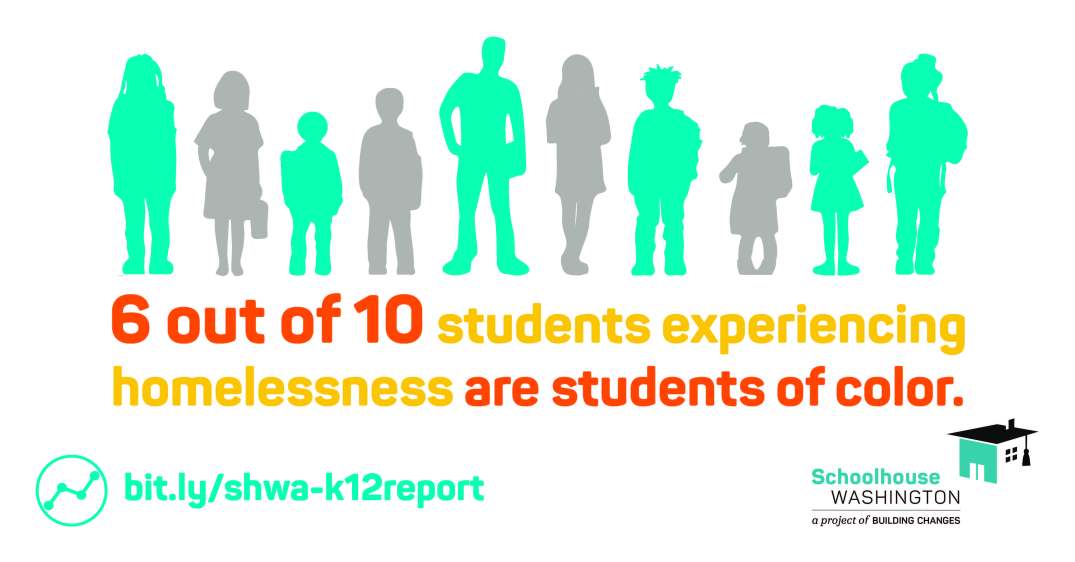
Download a pdf of this infographic (note: color appearing here is not true)

Download a pdf of this infographic (note: color appearing here is not true)
To read the full report and visit the new dashboard that enables you to find data by school district, visit the Schoolhouse Washington site.
WORK TYPE: Infographics
CLIENT: Schoolhouse Washington/Building Changes
DESIGNERS: Madison Vucci
YEAR: 2018
